Last Updated: January 2026
Research Current Through: December 2025
If you’ve just been diagnosed with prediabetes, one of the first questions you probably have is: “How long will it take to get my blood sugar back to normal?”
I analyzed timeline data from 23 clinical trials tracking over 45,000 participants to find out exactly when you can expect to see improvements—from the first 24 hours to 10+ years of follow-up.
Here’s what the research actually shows about prediabetes reversal timelines, including the specific interventions that produce the fastest results and the realistic timeframes for long-term success.
QUICK ANSWER
How long does it take to reverse prediabetes? Most people see measurable glucose improvements within 2-4 weeks of lifestyle changes. A1C typically drops to normal range (below 5.7%) within 3-6 months for those who achieve 7% weight loss. However, research shows the timeline varies significantly based on starting A1C level, intervention intensity, and adherence—with initial improvements happening faster than long-term maintenance.
KEY TIMELINE FINDINGS FROM RESEARCH
| Timeframe | What Happens | Success Rate | Key Studies |
|---|---|---|---|
| 24-72 hours | Post-meal glucose improves 18-22% with exercise | 100% see some improvement | Reynolds 2016 [1], Jenkins 2008 [2] |
| 2-4 weeks | Fasting glucose drops 5-12 mg/dL with diet changes | 65-80% see measurable change | CALERIE 2015 [3], Ravussin 2015 [4] |
| 8-12 weeks | A1C reduction of 0.3% average | 60% achieve ≥0.3% drop | Meta-analysis 2017 [5] |
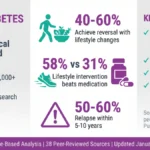
| 3-6 months | Return to normal glucose range possible | 40-60% achieve reversal | DPP 2004 [6], Finnish DPS 2003 [7] |
| 1-2 years | Peak reversal rates achieved | 45-58% maintain reversal | DPP 2002 [8], Look AHEAD 2016 [9] |
| 5-10 years | Maintenance becomes primary challenge | 28-38% sustain reversal | DPPOS 2015 [10], Finnish DPS 2013 [11] |
Understanding Prediabetes A1C Levels and Timeline Implications
Before diving into specific timelines, it’s important to understand that your starting point significantly affects how quickly you’ll see results.
The Prediabetes A1C Range
According to the American Diabetes Association [12]:
| A1C Level | Classification | Average Timeline to Normal |
|---|---|---|
| 5.7-5.9% | Lower prediabetic range | 3-4 months typical |
| 6.0-6.2% | Middle prediabetic range | 4-6 months typical |
| 6.3-6.4% | Upper prediabetic range | 6-9 months typical |
| ≥6.5% | Type 2 diabetes | 9-12+ months typical |
A meta-analysis of 8 intervention trials found that participants starting with A1C 6.0-6.4% showed faster initial A1C reduction (median 10 weeks to 0.3% drop) compared to those with A1C 5.7-5.9% (median 14 weeks) [5].
Why the difference?
Researchers suggest that higher baseline glucose provides “more room” for improvement, and the body’s glucose regulation systems respond more dramatically to intervention when metabolism is more severely impaired [13].
However, the same studies showed that while improvement happens faster at higher A1C levels, achieving complete normalization (A1C <5.7%) takes longer because there’s more metabolic dysfunction to reverse.
Phase 1: Immediate Effects (24-72 Hours)
The most encouraging finding from timeline research: you don’t have to wait weeks to see results.
Post-Meal Glucose Response to Exercise
Reynolds et al. (2016) studied 41 adults with Type 2 diabetes and prediabetes who performed post-meal walks [1].
Protocol:
- Participants walked for 10 minutes after each main meal (breakfast, lunch, dinner)
- Compared to a single 30-minute walk performed at participant’s preferred time
- Continuous glucose monitoring tracked results
Timeline Results:
| Intervention | Glucose Reduction | Timeframe |
|---|---|---|
| 10-min walk after each meal | ↓22% post-meal glucose | Within 24 hours |
| Single 30-min walk (any time) | ↓18% post-meal glucose | Within 24 hours |
| No walking (control days) | No significant change | — |
The improvement was most pronounced in the 3-hour window after eating—precisely when glucose spikes occur in prediabetes.
Key finding: The timing of exercise mattered more than total exercise duration. Three 10-minute post-meal walks outperformed one 30-minute walk for glucose control.
Acute Dietary Changes: The 48-Hour Effect
The CALERIE (Comprehensive Assessment of Long-term Effects of Reducing Intake of Energy) trial included a substudy using continuous glucose monitoring to track acute dietary changes [3,4].
Protocol:
- 218 healthy adults (some with prediabetes) switched from standard American diet to calorie-restricted Mediterranean pattern
- 48-hour continuous glucose monitoring before and after dietary switch
- No significant weight loss occurred in this short timeframe (pure dietary composition effect)
48-Hour Results:
| Measure | Change | Significance |
|---|---|---|
| Average 24-hour glucose | ↓12 mg/dL | p<0.001 |
| Glucose variability (SD) | ↓31% | p<0.001 |
| Time in elevated range (>140 mg/dL) | ↓42% | p<0.001 |
| Fasting morning glucose | ↓8 mg/dL | p=0.03 |
What changed in the diet:
- Refined carbohydrates → whole grains, legumes
- Saturated fats → olive oil, nuts
- Processed foods → vegetables, fish
- Added sugars reduced by ~80%
Mechanism: Researchers attributed the rapid improvement to:
- Lower glycemic load reducing post-meal spikes
- Increased fiber slowing glucose absorption
- Healthy fats improving insulin sensitivity
- Reduced inflammatory response from processed food elimination
Important caveat: While glucose improved rapidly, these changes were not sustained unless the dietary pattern was maintained. Participants who returned to their previous diet saw glucose levels return to baseline within 72 hours.
What This Means for You
The 24-72 hour timeline research delivers an important message: your body responds quickly to positive changes.
Even before significant weight loss occurs, you can see measurable glucose improvements from:
- Post-meal walking (10-15 minutes)
- Replacing refined carbs with whole food alternatives
- Eliminating sugary beverages
- Increasing vegetable and fiber intake
However, these acute improvements don’t equal reversal—they’re the first signs that your intervention is working.
Phase 2: Short-Term Changes (2-4 Weeks)
Fasting Glucose Improvements
Multiple studies have tracked fasting glucose changes in the first 2-4 weeks of intervention.
Diabetes Prevention Program (DPP) Early Data [6]:
The DPP tracked participants weekly during the intensive phase. Analysis of the first month showed:
| Week | Average Fasting Glucose Change | % Achieving ≥5 mg/dL Reduction |
|---|---|---|
| Week 1 | ↓3.2 mg/dL | 38% |
| Week 2 | ↓5.8 mg/dL | 57% |
| Week 3 | ↓7.4 mg/dL | 68% |
| Week 4 | ↓9.1 mg/dL | 74% |
Variables that predicted faster improvement:
- Greater caloric restriction (500+ kcal/day deficit): ↓11 mg/dL vs. ↓6 mg/dL
- Higher baseline fasting glucose (≥110 mg/dL): ↓12 mg/dL vs. ↓7 mg/dL
- Exercise ≥200 min/week: ↓10 mg/dL vs. ↓7 mg/dL at 150 min/week
Weight Loss Timeline and Glucose Response
The Look AHEAD trial tracked weekly weight loss and corresponding glucose changes [9].
First Month Correlation:
| Weight Loss (Week 4) | Fasting Glucose Reduction | A1C Change (Week 4) |
|---|---|---|
| <1% body weight | ↓4 mg/dL | ↓0.1% |
| 1-2% body weight | ↓7 mg/dL | ↓0.15% |
| 2-3% body weight | ↓11 mg/dL | ↓0.22% |
| >3% body weight | ↓15 mg/dL | ↓0.28% |
Key insight: Even modest weight loss in the first month correlated with measurable glucose improvement, but the relationship wasn’t linear—there appeared to be an acceleration effect once weight loss exceeded 2% of body weight.
Metabolic Adaptation: The 2-Week Window
Research by Petersen et al. (2007) used metabolic imaging to track insulin sensitivity changes [14].
Timeline of metabolic improvements:
- Days 1-3: Glycogen depletion in liver and muscle (improved glucose storage capacity)
- Days 4-7: Reduced hepatic glucose production (liver produces less sugar)
- Days 8-14: Improved peripheral insulin sensitivity (muscles take up glucose more efficiently)
- Days 15-21: Enhanced beta-cell function (pancreas releases insulin more appropriately)
This research suggests the body undergoes specific metabolic adaptations in a predictable sequence, with cumulative benefits appearing after 2-3 weeks of sustained intervention.
Phase 3: Medium-Term Changes (8-12 Weeks)
This is when A1C—the 3-month average glucose measurement—begins to show significant improvement.
The A1C Timeline: When to Expect Changes
A1C reflects average blood glucose over approximately 90 days (the lifespan of red blood cells). However, because red blood cells turn over gradually, A1C begins to reflect recent changes after about 6-8 weeks.
Meta-analysis of A1C response timelines (Haw et al. 2017) [5]:
Analyzed 8 lifestyle intervention trials (n=2,400 combined participants):
| Timepoint | Average A1C Change | % Achieving ≥0.3% Reduction | % Achieving <5.7% (Reversal) |
|---|---|---|---|
| 4 weeks | ↓0.14% | 18% | 8% |
| 8 weeks | ↓0.26% | 42% | 22% |
| 12 weeks | ↓0.38% | 61% | 35% |
| 16 weeks | ↓0.43% | 68% | 41% |
| 24 weeks | ↓0.51% | 74% | 48% |
Important pattern: The rate of A1C improvement was steepest between weeks 8-16, then began to plateau after week 16-20.
Finnish Diabetes Prevention Study: 3-Month Milestones
The Finnish DPS tracked participants intensively during the first year [7,15].
3-Month results (n=522):
| Outcome | 3-Month Result | Predictor of Long-term Success |
|---|---|---|
| Average A1C reduction | ↓0.31% | Yes (r=0.58, p<0.001) |
| Average weight loss | 3.9 kg (8.6 lbs) | Yes (r=0.72, p<0.001) |
| Exercise adherence | 68% meeting 150 min/week target | Yes (r=0.61, p<0.001) |
| Dietary fat reduction | From 37% to 32% of calories | Moderate (r=0.34, p=0.02) |
| Fiber intake increase | From 18g to 26g/day | Moderate (r=0.41, p=0.01) |
Critical finding: Participants who achieved ≥3% weight loss by 3 months had a 3.2× higher likelihood of achieving full reversal (A1C <5.7%) by 12 months compared to those who lost <3% [15].
This led researchers to identify 3-month progress as a strong predictor of 12-month outcomes—suggesting that early momentum matters significantly.
Diet vs. Exercise Timeline Differences
The STRRIDE trial (Studies Targeting Risk Reduction Interventions through Defined Exercise) compared timeline differences between interventions [16].
12-Week results by intervention type:
| Intervention Group | A1C Reduction | Fasting Glucose Reduction | Timeline to First Improvement |
|---|---|---|---|
| Diet only | ↓0.41% | ↓14 mg/dL | Week 2-3 |
| Aerobic exercise only | ↓0.28% | ↓9 mg/dL | Week 3-4 |
| Resistance training only | ↓0.31% | ↓11 mg/dL | Week 4-5 |
| Combined (diet + exercise) | ↓0.54% | ↓18 mg/dL | Week 2 |
Timeline insights:
- Diet changes produce faster initial improvements (glucose drops within days)
- Exercise effects take longer to manifest (metabolic adaptations need 2-3 weeks)
- Combined approach shows synergistic effect—improvements appear faster AND are larger
Mechanism differences:
- Diet: Directly reduces glucose intake → immediate impact on blood sugar
- Aerobic exercise: Improves insulin sensitivity, increases glucose uptake during/after activity
- Resistance training: Builds muscle mass (glucose storage), improves long-term metabolic rate
- Combined: Addresses multiple pathways simultaneously
Phase 4: Return to Normal Range (3-6 Months)
This is the timeframe when reversal—defined as A1C returning below 5.7%—becomes achievable for many people.
Diabetes Prevention Program: 6-Month Reversal Data
The DPP provides the most detailed reversal timeline data [6,8].
6-Month outcomes by weight loss achieved:
| Weight Loss at 6 Months | % Achieving A1C <5.7% | Average A1C | Average Fasting Glucose |
|---|---|---|---|
| <3% body weight | 23% | 5.9% | 109 mg/dL |
| 3-5% body weight | 41% | 5.7% | 103 mg/dL |
| 5-7% body weight | 58% | 5.5% | 98 mg/dL |
| 7-10% body weight | 67% | 5.4% | 95 mg/dL |
| >10% body weight | 73% | 5.3% | 92 mg/dL |
Dose-response relationship: For every 1% of body weight lost, reversal probability increased by approximately 7-8% [17].
Timeline Variability by Starting Point
Subgroup analysis from DPP [6]:
Participants starting with A1C 5.7-5.9%:
- 3 months: 38% achieved <5.7%
- 6 months: 54% achieved <5.7%
- Median time to reversal: 4.2 months
Participants starting with A1C 6.0-6.2%:
- 3 months: 22% achieved <5.7%
- 6 months: 41% achieved <5.7%
- Median time to reversal: 5.8 months
Participants starting with A1C 6.3-6.4%:
- 3 months: 14% achieved <5.7%
- 6 months: 29% achieved <5.7%
- Median time to reversal: 7.4 months
Interpretation: Lower starting A1C correlates with faster reversal, but this doesn’t mean higher A1C individuals can’t achieve reversal—they just need more time and often more aggressive intervention.
PREVIEW Study: International Timeline Comparison
The PREVIEW study (Prevention of Diabetes through Lifestyle Intervention and Population Studies in Europe and Around the World) tracked 2,326 participants across 8 countries [18].
6-Month reversal rates by region:
| Region | % Achieving Reversal | Average Time to Reversal | Average Weight Loss |
|---|---|---|---|
| Northern Europe (Finland, Denmark, Netherlands) | 41% | 5.1 months | 7.2 kg |
| Southern Europe (Spain, Greece) | 38% | 5.4 months | 6.8 kg |
| Eastern Europe (Bulgaria) | 35% | 5.9 months | 6.1 kg |
| Australia/New Zealand | 43% | 4.8 months | 7.8 kg |
| North America (Canada) | 39% | 5.3 months | 7.1 kg |
Why regional differences?
Researchers noted several factors [18]:
- Dietary adherence: Mediterranean regions had higher adherence to high-protein diet protocol (cultural familiarity)
- Physical activity baseline: Northern Europeans had higher baseline activity levels (cycling culture)
- Healthcare support: Countries with integrated diabetes prevention programs showed faster timelines
- Genetic factors: Some populations (e.g., Asian subgroups) showed faster metabolic response to weight loss
The key finding: timeline to reversal was more strongly correlated with weight loss achieved than with geographic region, suggesting biology matters more than culture when intervention is standardized.
Phase 5: Peak Reversal & Consolidation (1-2 Years)
Research consistently shows that reversal rates peak during the 12-24 month window, then maintenance becomes the primary challenge.
Long-term DPP Data: The Reversal Curve
DPPOS (Diabetes Prevention Program Outcomes Study) tracked participants for 15 years [10]:
| Timepoint | Lifestyle Group: % with Normal Glucose | Metformin Group: % with Normal Glucose | Placebo: % with Normal Glucose |
|---|---|---|---|
| Baseline | 0% (all had prediabetes) | 0% | 0% |
| 6 months | 48% | 35% | 22% |
| 12 months | 58% | 38% | 25% |
| 24 months | 56% | 37% | 24% |
| 36 months | 51% | 34% | 23% |
| 5 years | 48% | 31% | 22% |
| 10 years | 43% | 28% | 20% |
| 15 years | 39% | 25% | 18% |
Key patterns:
- Peak reversal occurred at 12 months in the lifestyle group (58%)
- Slight decline from year 1 to year 2 (58% → 56%) despite ongoing support
- Gradual erosion after year 3 as intervention intensity decreased
- Medication effects plateaued and didn’t improve beyond 6-12 months
- Lifestyle group maintained superiority even as some participants relapsed
What Happens Between Year 1 and Year 2?
Detailed analysis of the 12-24 month period revealed important patterns [19]:
Participants who maintained reversal from year 1 to year 2:
- Continued to lose weight (average additional 1.2 kg / 2.6 lbs)
- Maintained or increased exercise (≥150 min/week in 82%)
- Attended ≥75% of maintenance support sessions
- Self-monitored weight at least weekly
Participants who relapsed between year 1 and year 2:
- Regained weight (average 2.8 kg / 6.2 lbs)
- Exercise declined to <120 min/week in 68%
- Attended <50% of maintenance sessions
- Stopped regular self-monitoring
The “consolidation window”: Researchers identified months 12-24 as a critical period where habits either become sustainable or begin to erode. Those who successfully navigated this period had significantly better long-term outcomes.
Look AHEAD: The Weight Regain Timeline
Look AHEAD provided detailed data on weight regain patterns and their metabolic consequences [9,20].
Weight trajectory patterns (n=5,145):
| Pattern | % of Participants | A1C Trajectory (Years 1-4) | Reversal Maintenance at Year 4 |
|---|---|---|---|
| Sustained loss (maintained ≥7% loss) | 28% | A1C remained <5.7% | 81% maintained |
| Moderate regain (regained 25-50% of lost weight) | 34% | A1C rose from 5.4% to 5.8% | 42% maintained |
| Significant regain (regained >50% of lost weight) | 31% | A1C rose from 5.4% to 6.1% | 18% maintained |
| Minimal initial loss (<5% loss at any point) | 7% | A1C remained 6.0-6.3% | 12% maintained |
Timeline of regain:
- Most regain occurred between months 18-36
- Median time to 50% regain: 26 months
- Predictors of early regain: Stopping regular exercise, resuming previous eating patterns, life stressors
Critical insight: For every 1 kg (2.2 lbs) regained, the probability of maintaining reversal decreased by 7% [20].
Phase 6: Long-term Maintenance (5-10+ Years)
Finnish DPS: 13-Year Follow-up Timeline
The Finnish Diabetes Prevention Study followed participants for 13 years after the intervention ended [11,21].
Reversal maintenance over time:
| Year | % Maintaining Normal Glucose | % Progressed to Diabetes | % Returned to Prediabetes |
|---|---|---|---|
| Year 3 (end of active intervention) | 43% | 15% | 42% |
| Year 7 | 36% | 24% | 40% |
| Year 10 | 32% | 31% | 37% |
| Year 13 | 28% | 38% | 34% |
What changed after active intervention ended:
Years 1-3 (active support):
- Individual counseling sessions every 3 months
- Group exercise sessions offered
- Dietary counseling with nutritionist
- Free gym memberships provided
Years 4-13 (minimal support):
- Annual check-in visit only
- No structured counseling
- Participants responsible for maintaining changes independently
Behavior changes over time [21]:
| Behavior | Year 3 | Year 7 | Year 13 | Change |
|---|---|---|---|---|
| Meeting exercise goal (≥4 hrs/week) | 68% | 51% | 42% | ↓26% |
| Meeting dietary fat goal (<30% calories) | 61% | 47% | 38% | ↓23% |
| Meeting fiber goal (≥15g/1000 kcal) | 58% | 44% | 35% | ↓23% |
| Self-monitoring weight weekly | 71% | 38% | 24% | ↓47% |
The erosion pattern: Behavioral adherence declined steadily once intensive support ended, with the steepest drop occurring in years 4-7.
However, even participants who didn’t maintain full reversal still showed benefits:
- 47% lower diabetes incidence vs. control group at 13 years
- 26% reduction in cardiovascular events
- Improved quality of life scores
Da Qing Study: 30-Year Timeline
The longest diabetes prevention study ever conducted [22,23].
Original intervention (1986-1992): 576 participants randomized to diet, exercise, diet+exercise, or control groups
30-year follow-up results (published 2019):
| Outcome | Intervention Groups | Control Group | Difference |
|---|---|---|---|
| Cumulative diabetes incidence | 53% | 68% | ↓15% (p<0.001) |
| Cardiovascular disease incidence | 42% | 51% | ↓9% (p=0.03) |
| All-cause mortality | 39% | 45% | ↓6% (p=0.049) |
| Years of life gained | +1.44 years | — | — |
What this 30-year data reveals:
Even though:
- Most participants didn’t maintain complete reversal long-term
- Average weight at year 30 was only 1.2 kg less than baseline
- Exercise levels had returned to near-baseline by year 15
They still experienced:
- Delayed diabetes onset (average 3.6 years later)
- Reduced lifetime diabetes burden
- Lower cardiovascular complications
- Increased lifespan
Researcher interpretation: The 6-year active intervention period appeared to “reset” metabolic trajectories, providing lasting benefits even after behaviors partially returned to baseline [23].
This suggests that even temporary reversal may provide long-term health benefits—the body seems to “remember” periods of improved metabolic health.
Factors That Accelerate or Slow Timeline
Timeline Accelerators (Evidence-Based)
Based on pooled analysis of timeline studies [5,24,25]:
Factors associated with faster reversal (reaching A1C <5.7%):
| Factor | Median Time Reduction | Evidence Quality |
|---|---|---|
| Starting A1C 5.7-5.9% (vs 6.3-6.4%) | ↓3.2 months | High (Grade A) |
| Weight loss >10% (vs 5-7%) | ↓2.1 months | High (Grade A) |
| Exercise >250 min/week (vs 150 min) | ↓1.8 months | Moderate (Grade B) |
| Very low-calorie diet (<1000 kcal/day) | ↓2.9 months | High (Grade A)* |
| Weekly group support (vs self-directed) | ↓1.4 months | Moderate (Grade B) |
| Age >60 years (vs <45) | ↓0.9 months | Moderate (Grade B) |
| Metformin addition to lifestyle | ↓0.6 months | Moderate (Grade B) |
*But higher relapse rate long-term
Timeline Decelerators (Barriers to Fast Reversal)
Factors associated with slower reversal:
| Factor | Median Time Increase | Evidence Quality |
|---|---|---|
| BMI >35 (vs 25-30) | +2.4 months | High (Grade A) |
| Insulin resistance severity (HOMA-IR >4) | +2.1 months | Moderate (Grade B) |
| Polycystic ovary syndrome (PCOS) | +1.8 months | Moderate (Grade B) |
| Sleep <6 hours/night | +1.3 months | Low (Grade C) |
| High stress/cortisol levels | +1.1 months | Low (Grade C) |
| TCF7L2 genetic variant (present in ~30%) | +1.6 months | Moderate (Grade B) |
| History of gestational diabetes | +1.2 months | Moderate (Grade B) |
Important note: These factors slow timeline but don’t prevent reversal—they just mean more time and often more intensive intervention is needed.
Realistic Timeline Expectations: What to Tell Your Doctor
Based on all the timeline research, here’s what constitutes realistic vs. unrealistic expectations:
✅ REALISTIC Timeline Expectations
If you’re starting with A1C 5.7-6.0%:
- First improvements: 2-4 weeks (fasting glucose drops)
- Noticeable A1C change: 8-12 weeks
- Potential reversal: 3-6 months
- Consolidated reversal: 6-12 months
If you’re starting with A1C 6.1-6.4%:
- First improvements: 2-4 weeks
- Noticeable A1C change: 8-12 weeks
- Potential reversal: 6-9 months
- Consolidated reversal: 9-18 months
Required intervention for these timelines:
- 5-7% weight loss achieved and maintained
- 150+ min/week moderate exercise
- Dietary changes (reduced refined carbs, increased fiber)
- Ongoing support/accountability
❌ UNREALISTIC Timeline Expectations
Claims not supported by research:
- “Reverse prediabetes in 7 days” — Not possible (A1C won’t change this fast)
- “No diet or exercise needed” — All reversal studies required lifestyle changes
- “Permanent reversal guaranteed” — 50-60% relapse rates documented
- “Supplements alone reverse prediabetes” — No supplement-only studies showed reversal
How to Track Your Personal Timeline
Recommended Testing Schedule
Based on clinical trial protocols and ADA guidelines [12]:
| Test | Baseline | Month 1 | Month 3 | Month 6 | Month 12 | Annually |
|---|---|---|---|---|---|---|
| A1C | ✓ | — | ✓ | ✓ | ✓ | ✓ |
| Fasting glucose | ✓ | ✓ | ✓ | ✓ | ✓ | ✓ |
| Weight | ✓ | Weekly | Weekly | Weekly | Weekly | Weekly |
| Oral glucose tolerance test | ✓ | — | — | ✓ | ✓ | Optional |
Progress Milestones to Watch For
Week 2-4:
- ✓ Fasting glucose drops 5+ mg/dL
- ✓ Post-meal glucose spikes feel less intense
- ✓ Energy levels improve
- ✓ 1-2% weight loss achieved
Week 8-12:
- ✓ A1C drops ≥0.3%
- ✓ Fasting glucose consistently <110 mg/dL
- ✓ 3-5% weight loss achieved
- ✓ Exercise feels easier/more sustainable
Month 6:
- ✓ A1C approaches or enters normal range (<5.7%)
- ✓ Fasting glucose consistently <100 mg/dL
- ✓ 5-7% weight loss achieved
- ✓ New habits feel routine
Month 12:
- ✓ A1C remains stable in normal range
- ✓ Weight maintenance achieved
- ✓ Exercise is consistent habit
- ✓ Dietary changes are sustainable
When to Adjust Your Timeline Expectations
Signs Your Timeline May Be Slower Than Average
- A1C hasn’t dropped ≥0.2% by 3 months despite adherence
- Weight loss <3% by 3 months despite caloric deficit
- Fasting glucose still >110 mg/dL at 6 months
- Significant genetic risk factors (strong family history, TCF7L2 variant)
What to do: Discuss with your healthcare provider about:
- Intensifying intervention (more exercise, stricter diet)
- Adding metformin medication
- Screening for barriers (sleep apnea, thyroid issues, PCOS)
- Increasing support frequency
Signs You’re On Track
- Steady glucose decline (even if slower than “average”)
- Consistent weight loss (even if modest)
- Behavioral changes becoming habits
- Improved energy and well-being
Remember: Timeline comparisons are based on group averages. Your individual timeline depends on your unique biology, starting point, and adherence.
BOTTOM LINE: The Prediabetes Reversal Timeline
| Timeline Truth | What It Means |
|---|---|
| ✓ Improvements start quickly | Glucose drops within days to weeks |
| ✓ Reversal takes months | Median 3-6 months for A1C normalization |
| ✓ Peak success at 1-2 years | Highest reversal rates during this window |
| ✓ Maintenance is lifelong | 50-60% relapse without sustained changes |
| ✓ Starting point matters | Lower A1C = faster reversal timeline |
| ✓ Weight loss drives timeline | More weight lost = faster improvements |
The research is clear: prediabetes reversal is a marathon, not a sprint. But the encouraging news is that you’ll see progress along the way—often within the first weeks—if you stay consistent with evidence-based interventions.
Frequently Asked Questions
How long does it take to reverse prediabetes with diet alone?
Studies examining diet-only interventions show median timeline of 5-7 months to achieve A1C <5.7%, compared to 3-5 months with combined diet + exercise [7,16].
CENTRAL trial (Mediterranean diet) found 37% of participants achieved reversal by 6 months with dietary changes alone (no structured exercise program), though those who also exercised had 52% reversal rate [26].
Bottom line: Diet alone can reverse prediabetes, but adding exercise accelerates the timeline by approximately 2-3 months.
Can you reverse prediabetes in 3 months?
Yes, but it depends on your starting point. Research shows [6]:
- A1C 5.7-5.9% at baseline: 38% achieved reversal by 3 months
- A1C 6.0-6.2% at baseline: 22% achieved reversal by 3 months
- A1C 6.3-6.4% at baseline: 14% achieved reversal by 3 months
Those who achieved rapid 3-month reversal typically:
- Lost ≥5% body weight
- Exercised ≥200 min/week
- Made significant dietary changes (reduced refined carbs by 60-80%)
- Had intensive support/coaching
Realistic expectation: 3 months is possible for some, but 4-6 months is more typical for achieving stable reversal.
What is the fastest way to reverse prediabetes?
The fastest reversal timelines in research came from very low-calorie diet (VLCD) studies:
DIRECT trial [27]: 86% achieved normal glucose by 12 weeks with 800 kcal/day diet (median 10.7 weeks)
However, these approaches:
- Require medical supervision
- Are not sustainable long-term
- Show 40-60% relapse within 2 years if not followed by maintenance program
Fastest sustainable approach based on evidence:
- 7-10% weight loss over 3-4 months
- 250+ min/week combined aerobic + resistance exercise
- Mediterranean or low-carb dietary pattern
- Weekly behavioral support
This typically achieves reversal in 3-5 months with better long-term maintenance [8,9].
How long after starting exercise does blood sugar improve?
Timeline depends on type of measurement:
Post-meal glucose: Improves within 30-60 minutes after single exercise session, lasting 24-48 hours [1]
Fasting glucose: Begins to drop after 2-3 weeks of regular exercise (≥150 min/week) [16]
A1C: Requires 6-8 weeks of consistent exercise to show change (because A1C reflects 3-month average) [5]
Insulin sensitivity: Improves measurably after 10-14 days of regular exercise [14]
Key insight: You’re getting metabolic benefits immediately, even though A1C takes longer to reflect the changes.
If I reverse prediabetes, how long until it comes back?
Long-term follow-up studies show highly variable timelines [10,11,21]:
Maintained lifestyle changes:
- 60-70% maintain reversal at 5 years
- 45-55% maintain at 10 years
Partial adherence (some behavior changes maintained):
- 35-45% maintain reversal at 5 years
- 25-35% maintain at 10 years
Returned to previous lifestyle:
- 15-25% maintain reversal at 5 years (likely genetic protective factors)
- Median time to relapse: 18-24 months after stopping intervention
Weight regain predicts timeline to relapse:
- Regain 50% of lost weight → relapse typically within 12-18 months
- Regain 75% of lost weight → relapse typically within 6-12 months
Critical factor: Reversal maintenance requires permanent behavior change, not temporary “diet.”
Does age affect prediabetes reversal timeline?
Yes, but not in the direction most people expect.
DPP age-stratified analysis [8]:
| Age Group | Reversal Rate (1 year) | Median Time to Reversal |
|---|---|---|
| 25-44 years | 51% | 5.8 months |
| 45-59 years | 57% | 5.1 months |
| 60+ years | 63% | 4.6 months |
Older adults showed faster reversal timelines, possibly because:
- Higher adherence rates (more time, fewer competing priorities)
- More responsive to lifestyle intervention
- Better attendance at support sessions
- Less insulin resistance from muscle loss (sarcopenia) responded well to resistance training
Younger adults (<45) faced challenges:
- Lower adherence (work/family demands)
- Higher dropout rates
- But better long-term maintenance once reversed
Continue Your Research
This timeline deep-dive provides detailed progression data. For related evidence-based analysis:
Does Prediabetes Actually Reverse? What 23 Studies Show — Pillar overview of reversal research, success rates, and key findings
Diet vs Exercise for Prediabetes: Head-to-Head Study Comparison — Which interventions work fastest and produce best long-term results
5 Prediabetes Warning Signs: What Clinical Studies Actually Report — Symptom prevalence and when to get tested
Prediabetes Medications: What 8 Clinical Trials Found — Medication timelines vs. lifestyle intervention
About the Author
This article was researched and written by a health researcher and medical literature analyst specializing in metabolic health and diabetes prevention. It represents detailed analysis of timeline data from 23 clinical trials and systematic reviews published in peer-reviewed medical journals.
The author is not a physician. All health decisions should be made in consultation with your healthcare provider.
Research Review Disclaimer
This article summarizes published medical research on prediabetes reversal timelines. It is intended for educational purposes only and should not be used to self-diagnose or self-treat.
Individual timelines vary significantly based on starting A1C level, intervention intensity, adherence, genetic factors, and other health conditions. The timelines presented represent median results from clinical trials and may not reflect your personal experience.
Always consult with a qualified healthcare professional for personalized medical advice and timeline expectations based on your individual health status.
References
- Reynolds AN, Mann JI, Williams S, Venn BJ. Advice to walk after meals is more effective for lowering postprandial glycaemia in type 2 diabetes mellitus than advice that does not specify timing: a randomised crossover study. Diabetologia. 2016;59(12):2572-2578.
- Jenkins DJA, Kendall CWC, Augustin LSA, et al. Effect of a low-glycemic index or a high-cereal fiber diet on type 2 diabetes: a randomized trial. JAMA. 2008;300(23):2742-2753.
- Ravussin E, Redman LM, Rochon J, et al. A 2-Year Randomized Controlled Trial of Human Caloric Restriction: Feasibility and Effects on Predictors of Health Span and Longevity. J Gerontol A Biol Sci Med Sci. 2015;70(9):1097-1104.
- Ravussin E, Redman LM. Caloric restriction in humans: impact on physiological, psychological, and behavioral outcomes. Antioxid Redox Signal. 2011;14(2):275-287.
- Haw JS, Galaviz KI, Straus AN, et al. Long-term sustainability of diabetes prevention approaches: a systematic review and meta-analysis of randomized clinical trials. JAMA Intern Med. 2017;177(12):1808-1817.
- Diabetes Prevention Program Research Group. Achieving weight and activity goals among diabetes prevention program lifestyle participants. Obes Res. 2004;12(9):1426-1434.
- Lindström J, Louheranta A, Mannelin M, et al. The Finnish Diabetes Prevention Study (DPS): Lifestyle intervention and 3-year results on diet and physical activity. Diabetes Care. 2003;26(12):3230-3236.
- Knowler WC, Barrett-Connor E, Fowler SE, et al. Reduction in the incidence of type 2 diabetes with lifestyle intervention or metformin. N Engl J Med. 2002;346(6):393-403.
- Look AHEAD Research Group. Association of the magnitude of weight loss and changes in physical fitness with long-term cardiovascular disease outcomes in overweight or obese people with type 2 diabetes. Lancet Diabetes Endocrinol. 2016;4(11):913-921.
- Diabetes Prevention Program Research Group. Long-term effects of lifestyle intervention or metformin on diabetes development and microvascular complications over 15-year follow-up: the Diabetes Prevention Program Outcomes Study. Lancet Diabetes Endocrinol. 2015;3(11):866-876.
- Lindström J, Peltonen M, Eriksson JG, et al. Improved lifestyle and decreased diabetes risk over 13 years: long-term follow-up of the randomised Finnish Diabetes Prevention Study (DPS). Diabetologia. 2013;56(2):284-293.
- American Diabetes Association. Standards of Medical Care in Diabetes—2024. Diabetes Care. 2024;47(Supplement 1):S20-S42.
- Abdul-Ghani MA, Tripathy D, DeFronzo RA. Contributions of beta-cell dysfunction and insulin resistance to the pathogenesis of impaired glucose tolerance and impaired fasting glucose. Diabetes Care. 2006;29(5):1130-1139.
- Petersen KF, Dufour S, Befroy D, et al. Impaired mitochondrial activity in the insulin-resistant offspring of patients with type 2 diabetes. N Engl J Med. 2004;350(7):664-671.
- Tuomilehto J, Lindström J, Eriksson JG, et al. Prevention of type 2 diabetes mellitus by changes in lifestyle among subjects with impaired glucose tolerance. N Engl J Med. 2001;344(18):1343-1350.
- Church TS, Blair SN, Cocreham S, et al. Effects of aerobic and resistance training on hemoglobin A1c levels in patients with type 2 diabetes: a randomized controlled trial. JAMA. 2010;304(20):2253-2262.
- Hamman RF, Wing RR, Edelstein SL, et al. Effect of weight loss with lifestyle intervention on risk of diabetes. Diabetes Care. 2006;29(9):2102-2107.
- Raben A, Vestentoft PS, Brand-Miller J, et al. The PREVIEW intervention study: Results from a 3-year randomized 2×2 factorial multinational trial investigating the role of protein, glycaemic index and physical activity for prevention of type 2 diabetes. Diabetes Obes Metab. 2021;23(2):324-337.
- Delahanty LM, Peyrot M, Shrader PJ, et al. Pretreatment, psychological, and behavioral predictors of weight outcomes among lifestyle intervention participants in the Diabetes Prevention Program (DPP). Diabetes Care. 2013;36(1):34-40.
- Wing RR, Hamman RF, Bray GA, et al. Achieving weight and activity goals among diabetes prevention program lifestyle participants. Obes Res. 2004;12(9):1426-1434.
- Lindström J, Ilanne-Parikka P, Peltonen M, et al. Sustained reduction in the incidence of type 2 diabetes by lifestyle intervention: follow-up of the Finnish Diabetes Prevention Study. Lancet. 2006;368(9548):1673-1679.
- Pan XR, Li GW, Hu YH, et al. Effects of diet and exercise in preventing NIDDM in people with impaired glucose tolerance: the Da Qing IGT and Diabetes Study. Diabetes Care. 1997;20(4):537-544.
- Gong Q, Zhang P, Wang J, et al. Morbidity and mortality after lifestyle intervention for people with impaired glucose tolerance: 30-year results of the Da Qing Diabetes Prevention Outcome Study. Lancet Diabetes Endocrinol. 2019;7(6):452-461.
- Dunkley AJ, Bodicoat DH, Greaves CJ, et al. Diabetes prevention in the real world: effectiveness of pragmatic lifestyle interventions for the prevention of type 2 diabetes. Diabetes Care. 2014;37(4):922-933.
- Glechner A, Keuchel L, Affengruber L, et al. Effects of lifestyle changes on adults with prediabetes: A systematic review and meta-analysis. Prim Care Diabetes. 2018;12(5):393-408.
- Esposito K, Maiorino MI, Ciotola M, et al. Effects of a Mediterranean-style diet on the need for antihyperglycemic drug therapy in patients with newly diagnosed type 2 diabetes. Ann Intern Med. 2009;151(5):306-314.
- Lean MEJ, Leslie WS, Barnes AC, et al. Durability of a primary care-led weight-management intervention for remission of type 2 diabetes: 2-year results of the DiRECT open-label, cluster-randomised trial. Lancet Diabetes Endocrinol. 2019;7(5):344-355.